SPATIAL ASSESSMENT OF POVERTY DISTRIBUTION
IN WEST JAVA PROVINCE
INTRODUCTION
Poverty is a major problem for many countries in the world, a condition where a person cannot fulfill basic needs such as food, clothing, medicine and shelter. Poverty reduction is the main target of development programs in accordance with the mainstreaming of the Millennium Development Goals (MDGs) and Sustainable Development Goals (SDGs) agendas in the National Long Term Development Plan (RPJPN 2005-2025). The poverty reduction program launched by the government has succeeded in reducing the percentage of poverty, although in nominal terms the number of poor people is still quite high. Development is essentially a continuous process between various dimensions, both social, economic and environmental, which aims for the welfare of society. Measures of the social and economic conditions of society (poverty) are included in the assessment of development success. The method of integrating poverty attribute data with regional maps can visualize the distribution of poor people in an area. The available poverty data is presented in two data models, namely macro poverty data and micro poverty data. In order to achieve spatial equality, visualization is presented in district/city regional units throughout West Java Province which is packaged in WebGIS so that information can be easily accessed by those who need it. Information on spatial assessments of the distribution of poor people and the success of handling programs can be accessed via https://jabar.netlify.app/.
Poverty is also a measure of social and economic conditions in assessing the success of government development in a region (Priseptian and Primandhana, 2022). Poverty has become a serious problem during the economic downturn due to the Covid-19 pandemic, the declining economic conditions have caused an increase in poverty rates in Indonesia. Based on data from the Central Statistics Agency (2020), the percentage of poor people in Indonesia increased in 2020, namely 9.78 percent in semester 1 and experienced an increase again in semester 2 of 10.19 percent. One of the reasons for the increase in the percentage of poor people in Indonesia is the Covid-19 pandemic. According to Topcu (2022), the Covid-19 pandemic that hit indirectly hampered efforts to eradicate poverty globally. The percentage of poor people in West Java was recorded at 8.4 percent (BPS, 2021), which is the province with the lowest poverty rate in Indonesia. If we look at population data in absolute terms, the number of poor people in West Java province is in second place nationally, namely 4.2 million people and makes West Java Province one of the regions with high poverty in Indonesia.
The physical and environmental factors of a place are identified based on site and situation. Site is all the internal properties or characteristics of a particular area, including size, shape, topography and all physical conditions. Meanwhile, what is meant by situation is that which relates to its external characteristics. The situation of a place is closely related to the relationship of that place with surrounding places in the same geographic space. Included in the definition of situation is accessibility/ease of reaching supporting infrastructure, availability of facilities and infrastructure such as transportation networks, electricity, drinking water and so on. In terms of topography, the Southern part of West Java Province has a minimal road network with relief topographic conditions, resulting in the Southern West Java Region's economic pulse lagging far behind the central and northern regions. The road network in the southern region is very small (±28.45%) compared to the northern and central regions (±71.55%), this condition greatly influences population mobility. The population distribution in the northern and central regions is 73% with a density of 57 inhabitants/ha, in the south the population is 27% with a density of 6 inhabitants/ha (Riadi and Munajati, 2015).
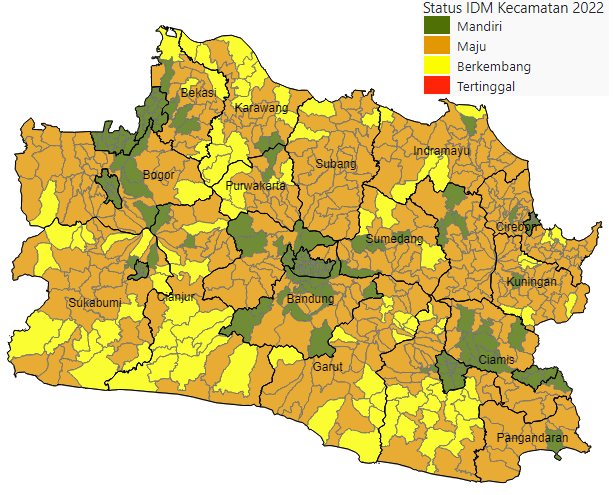
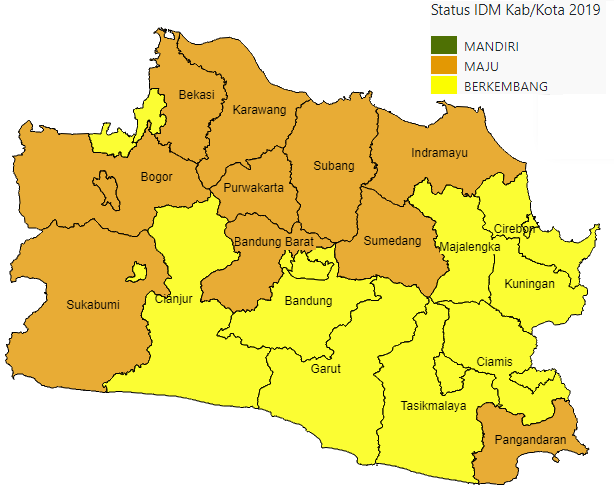
Integration of tabular data (secondary data) obtained from BPS and the Ministry of Villages with spatial data from BIG used as a basis for conducting a spatial assessment of the distribution of the poor population in West Java Province. Poverty data obtained from BPS, with the assessment that poverty is seen as an economic inability to meet needs basic food and non-food items measured from the expenditure side. Residents are categorized as poor if they have average expenditure per capita per month below the poverty line. Village development underwent a transformation by providing recognition and delegation of authority to village communities to manage and carry out their affairs autonomously. Village autonomy includes aspects of self-governing community according to original rights proposals and aspects of local self-government, meaning providing recognition and handover of village-scale power, which gives broad authority to villages in the field of village governance, implementation of village development, development of village communities, and empowerment of village communities based on community initiative, origin rights, and village customs. IDM is a composite index formed based on three indices, namely the Resilience Index Social, Economic Resilience Index and Ecological/Environmental Resilience Index (Ministry of Villages, 2019). The dimensions of economic resilience that form IDM include production villages, distribution access, trade access, access to financial institutions, economic institutions and openness to trade. The dimension of economic resilience is very important related to the circulation of money and equal distribution of income in the village. All aspects of the economic resilience dimension reflect increased development villages which will mean improving the economy of village communities.
Geographic information systems (GIS) are an appropriate method for mapping an area, with a wide coverage of the study area analysis can be carried out in a relatively short time. It is hoped that the geographic information system (GIS) method will make it easier to present spatial information on the distribution of poor people in a province. WebGIS is an online-based Geographic Information System application which is a combination of standard web and mapping web. WebGIS is widely used to publish map-based spatial information. Therefore, this research will utilize webGIS to model the spatial information system for the distribution of the poor population. In this research, webGIS was developed using a file-based geospatial data system, namely files in GeoJSON format. This data is sent to the user to be displayed on the internet using OpenLayers software. The geospatial data used is the result of data processing in the form of shapefile data which is converted into GeoJSON data.
The scope of this research was carried out in three ways. First, conducting a literature study regarding the concept of poverty and village community development methods, collecting data from the Central Statistics Agency (BPS) and the Ministry of Villages, Development of Disadvantaged Regions and Transmigration. Second, collect spatial data for the West Java Province region from the Geospatial Information Agency (BIG) and continue by integrating BPS data with spatial data (maps). Third, carry out geographical observations to detect the percentage and distribution of the poor population, spatially interpret the distribution of the poor population based on indicators of regional isolation and road infrastructure readiness and can be presented in an internet/WebGIS based information system.
LITERATURE REVIEW
Spatial Data
Spatial data is geographically referenced data that represents objects on earth in a flat plane. Spatial data contains interpretations and projections of all natural and man-made phenomena on the face of the earth. There are two types of spatial data, namely vector type and raster type. Vector data interprets the surface of the earth in the form of points, lines or curves, or polygons and their attributes, while the raster data model uses a matrix structure or pixels that form a grid. This research will utilize these two spatial data models (vector and raster) with analysis methods: overlay, clip, intersect, buffer, query, union, merge; which one will be selected or combined.
Percentage of the Poor Population
According to BPS (2022), in measuring poverty using the concept of the ability to meet basic needs (basic needs approach), with this approach poverty is seen as an economic inability to meet basic food and non-food basic needs which are measured in terms of expenditure. So the Poor Population is a population that is categorized as having an average per capita expenditure per month below the poverty line. In this case, the Poverty Line (GK) will reflect the rupiah value of the minimum expenditure required by a person to fulfill his basic life needs for a month, both food and non-food needs. In this research, data from the Head Count Index (HCI-P0) in the form of the percentage of the population below the Poverty Line (GK) from BPS is used, the calculation uses the following formula:
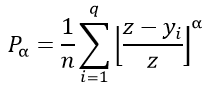
Where :
a = 0
z = poverty line..
yi = Average monthly per capita expenditure of the population below the poverty line (i=1, 2, 3, ...., q), yi < z
q = Number of people who are below the poverty line.
N = total population.
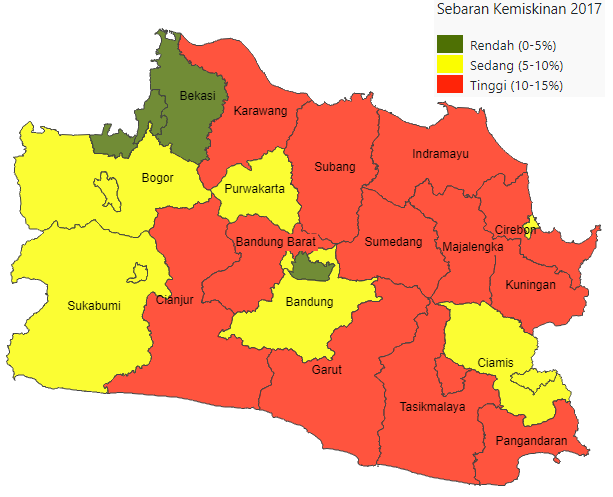
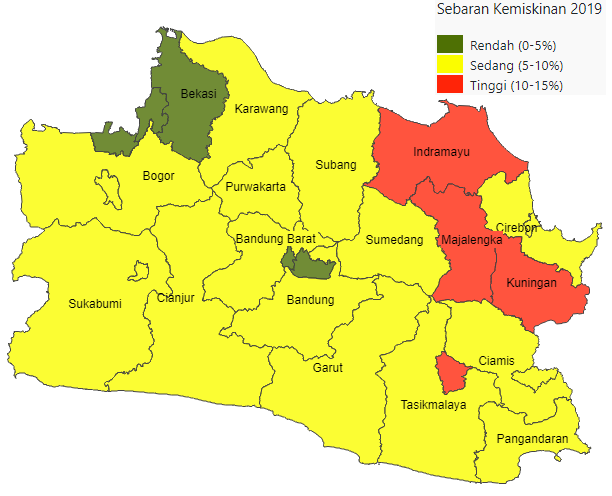
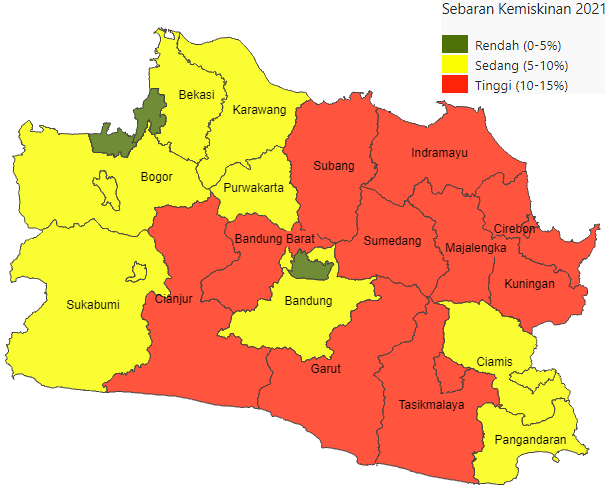
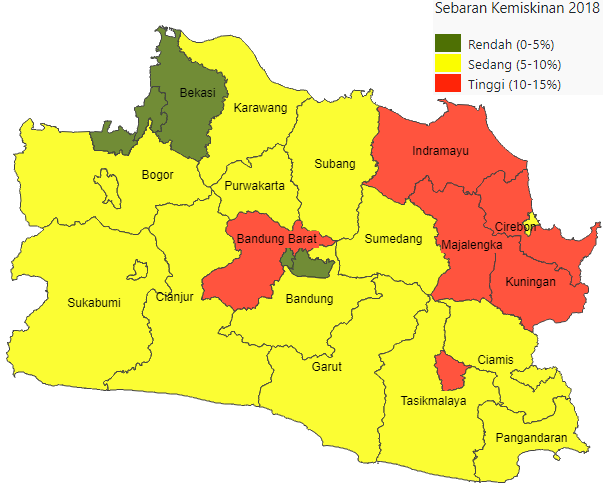
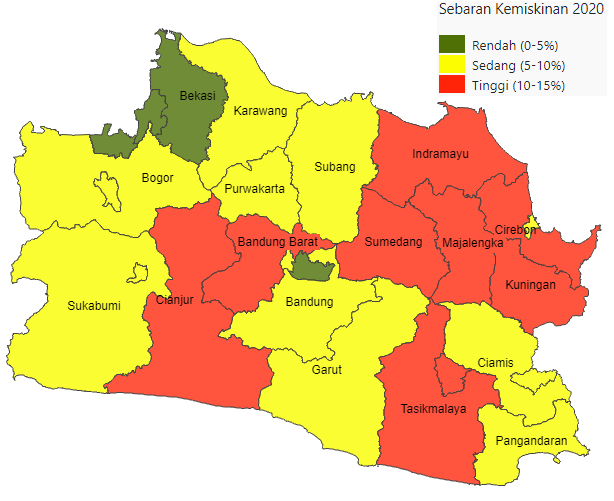
Poverty distribution pattern (BPS, 2021), the percentage of poor people in districts/cities in West Java Province has a diverse distribution ranging from low (2.6%-5.3%), medium (5.3% - 9.7%) ), and high (9.7% - 13.1%) and for spatial purposes the distribution pattern is simplified into low (0% - 5%), medium (5% - 10%) and high (10% - 15%) .
The percentage of village and sub-district poverty status is classified (Dyah, Sasmito and Apriliyani, 2021) as follows: non-poor status 0% - 15%, almost poor 15% - 25%, poor 25% - 30% and very poor 30% - 100 %. The village and sub-district poverty level values are calculated using the percentage formula:
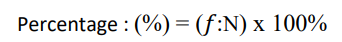
Remarks:
f : number of poor people in the village/sub-district
N : number of village/sub-district residents..
The Village Development
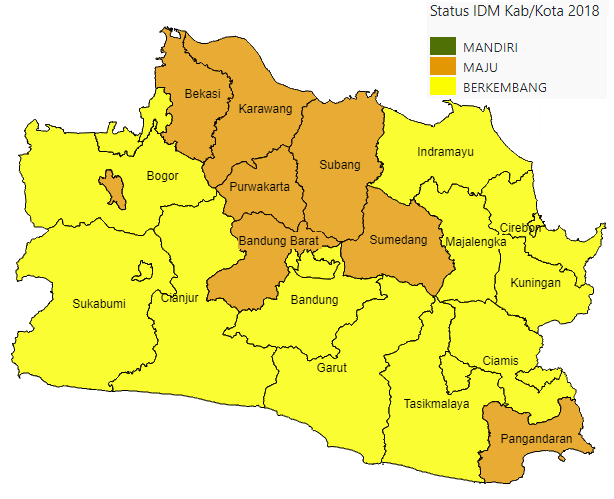
The number of villages and sub-districts in Indonesia has reached 74,093 villages, 8,412 sub-districts (Ministry of Home Affairs, 2015), which has had a large impact on high levels of poverty in rural areas. This condition is important for developing rural areas to become more advanced by exploring the potential of each village in order to improve the prosperity of its people. The concept of village development is monitored using the Village Development Index (IDM) in the form of a composite index formed from 3 types of indices, namely the Social Resilience Index, Economic Resilience Index and Ecological/Environmental Resilience Index. The Village Development Index (IDM) functions as a map of development development in the Village and can be used as a reference in carrying out integration, affirmation and development synergy. With the hope that conditions can be created for rural communities that are prosperous, just and independent. To measure and determine the IDM value of a village, the formula is:
IDM = (IKS+IKE+IKL)/3
Where :
IDM: Developing Village Index Value
IKS: Social Resilience Index Value
IKE: Economic Resilience Index Value
IKL: Environmental Resilience Index Value
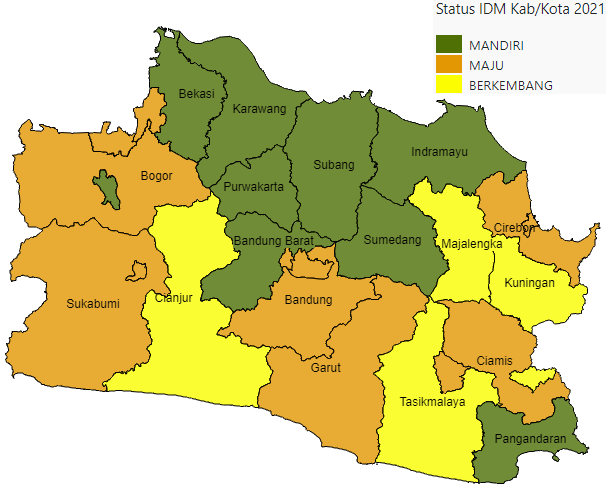
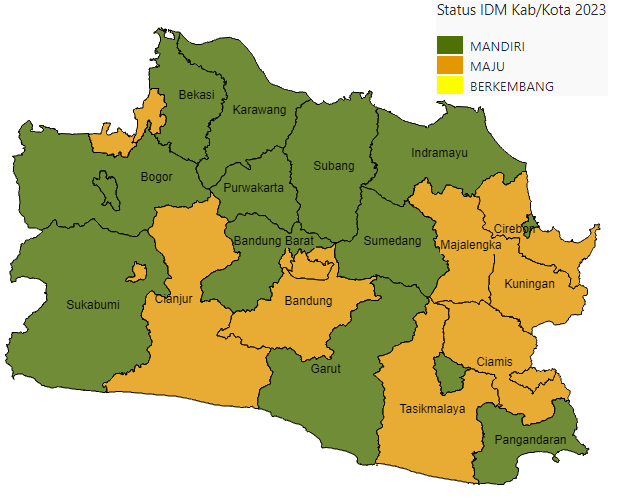
So, the components that are used as an assessment to determine whether the status of a village is included in the Independent, Advanced, Developing and Disadvantaged Village Category are the Social Resilience, Economic Resilience and Environmental Resilience factors.
According to the Ministry of Villages PDTT (2023), there are five (5) classifications of the status of village progress and independence, namely:
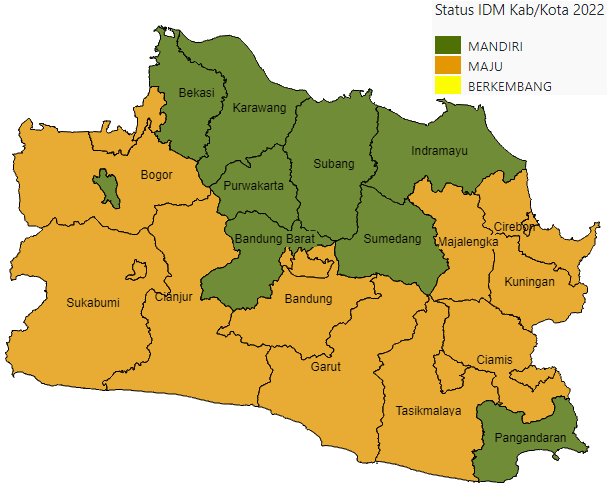
- Self-Reliant Village or Highly Advanced (Self-Sufficient Village) is a village that has the ability to carry out village development to improve the well-being and quality of life of its residents with sustainable social, economic, and ecological resilience. A Self-Reliant Village is a village with an Index of Village Development (Indeks Desa Membangun) greater than 0.8155.
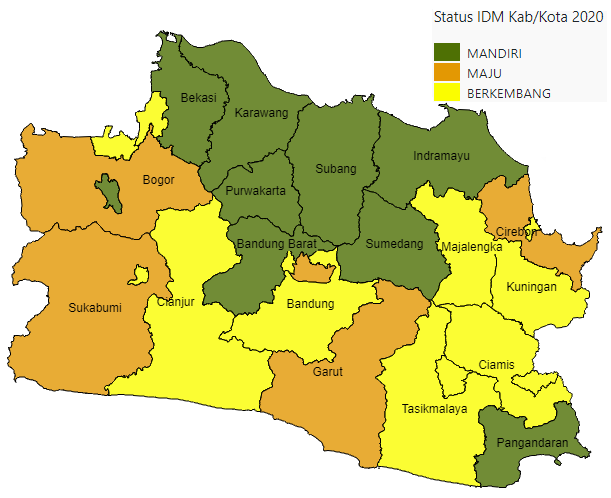
- Advanced Village (Pre-Self-Sufficient Village) is a village that has the potential for social, economic, and ecological resources and the ability to manage them for the betterment of the village community, human quality of life, and poverty reduction. An Advanced Village is a village with an Index of Village Development less than or equal to 0.8155 and greater than 0.7072.
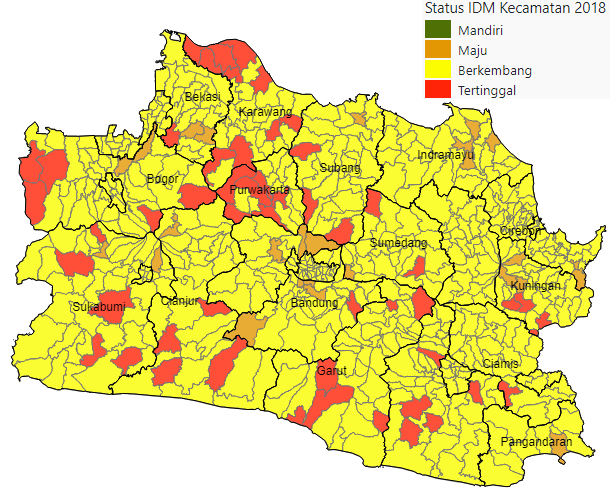
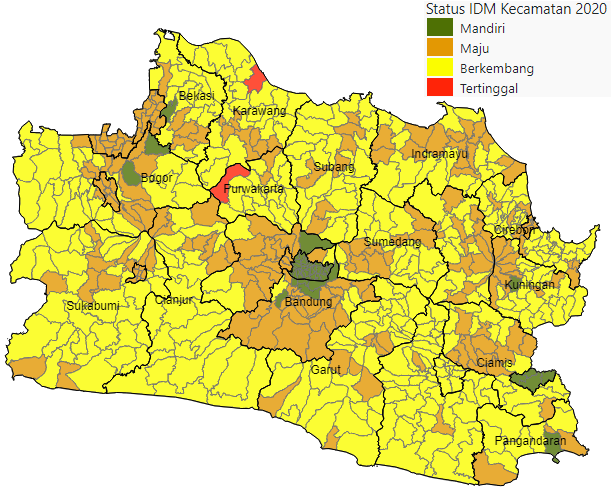
- Developing Village (Intermediate Village) is a village that possesses social, economic, and ecological resources but has not yet optimally managed them. A Developing Village is a village with an Index of Village Development less than or equal to 0.7072 and greater than 0.5989.
- Backward Village (Pre-Intermediate Village) is a village that has not optimally managed its social, economic, and ecological resource potential in efforts to improve the well-being of the village community, human quality of life, and is experiencing various forms of poverty. A Backward Village is a village with an Index of Village Development less than or equal to 0.5989 and greater than 0.4907.
- Highly Backward Village (Primary Village) is a village that experiences various forms of poverty and is vulnerable to social conflicts, economic shocks, and various natural disasters. Thus, it is unable to manage the economic, social, and ecological resource potential it possesses. A Highly Backward Village is a village with an Index of Village Development less than 0.4907.
Spatial Processing
The management, processing, and analysis of spatial data depend on the data model. This spatial data management, processing, and analysis utilize GIS modeling based on specific needs and analysis. Spatial data processing includes various techniques such as feature overlay, clip, intersect, buffer, query, union, and merge. Spatial data processing can be carried out using geoprocessing techniques that involve combining different values based on specific attributes. Analytical methods in spatial data processing covers processes such as overlay and the integration of spatial data with non-spatial (attribute) data. Descriptive analysis is used to understand the overall spatial distribution of poverty in West Java and the possibility of conducting inferential analysis to determine whether there are spatial effects affecting poverty in West Java in 2022.
Such spatial data processing can be done using a technique called geoprocessing (ESRI, 2020), this processing includes:
- overlay is a combination of two spatial data layers,
- clip is the intersection of an area based on another area as a reference,
- intersection is the intersection of two areas that have similar characteristics and criteria,
- buffer is adding an area around a certain spatial object,
- query is data selection based on certain criteria,
- union is a merger/combination of two spatial areas and their different attributes into one,
- merge is the combination of two different data regarding spatial features,
- dissolve is combining several different values based on certain attributes.
Management, processing and analysis of spatial data usually depends on the data model. Management, processing and analysis of spatial data utilizes GIS modeling based on needs and analytics. Analytics that apply to spatial data processing such as overlay, clip, intersect, buffer, query, union, and merge.
The analysis used in this research is descriptive analysis, used to determine the general spatial picture of poverty in West Java. Inferential analysis is used to find out whether there are spatial effects that influence poverty in West Java in 2021.
METHODOLOGY
Spatial analysis has specific characteristics as it can be used in various research fields. Spatial analysis activities use Geographic Information System (GIS) techniques that rely on geographically located data for analysis, storage, and visualization. The best results from GIS analysis can be achieved by analyzing spatial data and attribute data integratively. Attribute data may include social, cultural, and economic data, serving as object identifiers in the database, making it easier to trace objects in the database. The purpose of this research is to identify the distribution patterns of the impoverished population and the success of government programs in addressing them in the West Java province using the integration of spatial and non-spatial data.
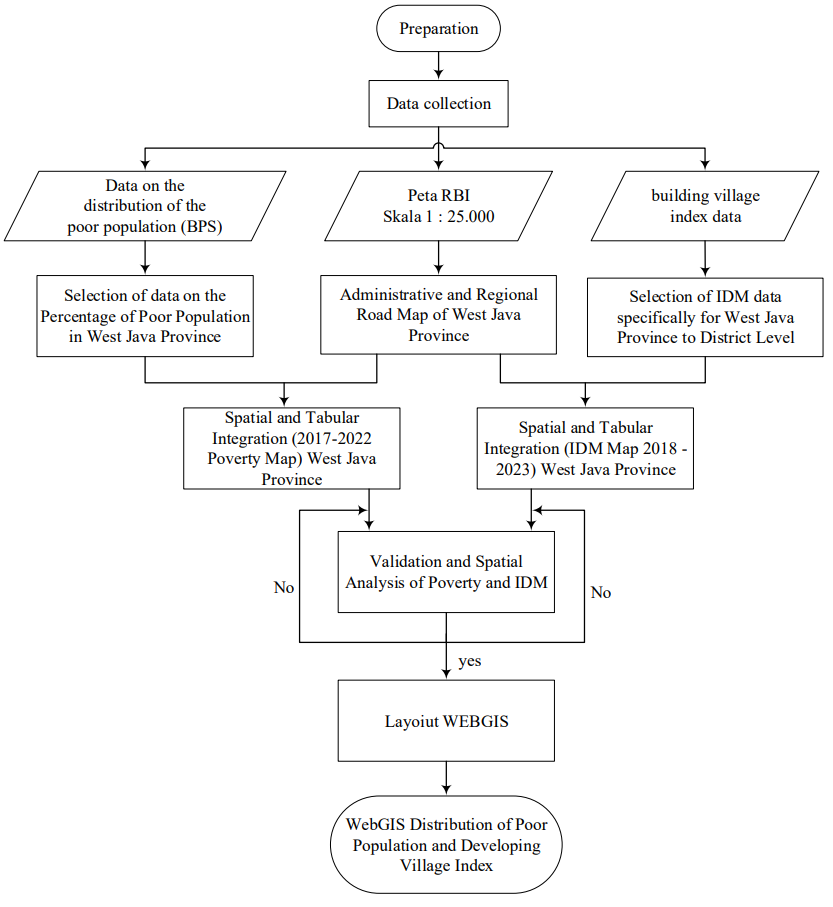
Figure 1. Research Methodology
Overlay, or superimposition, is one of the procedures in GIS analysis (Geographic
Information Systems), this is the capability to place the graphics of one map on top of another
map and visualize the results on a computer screen. Overlay involves overlaying one map on
top of another (at least 2 maps) along with their attributes and produces a combined map that
contains attribute information from both maps, resulting in a new map.
The spatial assessment in this research is intended to assess the overlay of the poverty map with the village development index map which will provide new map analysis results that reflect the current condition of the distribution of the poor population.
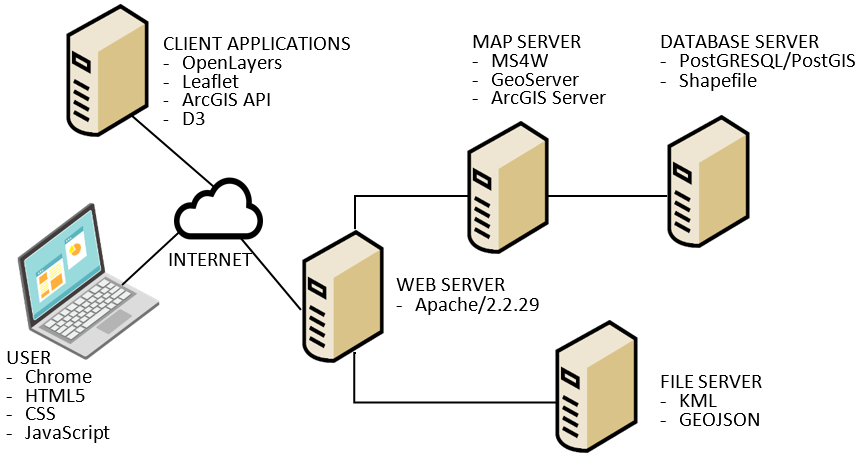
Figure 2. Architecture of WebGIS
Validation and spatial analysis of poverty and IDM are displayed as web maps developed using webGIS techniques. The web map is made to comply cartographic rules in terms of symbology, layout and interactive presentation so that web maps will be easy to read and display. The web map separately has a title, menu and map page. The title of the map is "MAP OF THE POVERTY DISTRIBUTION AND INDEX OF DEVELOPING VILLAGES (IDM) OF WEST JAVA PROVINCE 2017 - 2023". The menu was developed in the form of a navigation bar with menu contents, namely site information, maps and reports. The map menu consists of a poverty map menu and a Regency/City IDM menu and menu District IDM. Besides that, a Report menu is available so that users can get an explanation of the themes and techniques used.
The map page displays the map contents, map scale, mouse coordinates and tools for zoom and pan. The contents of the map consist of a poverty map, a Regency/City IDM map and District IDM maps with a time span from 2018 to 2023. These maps are distribution maps where poverty information is presented in the form of an area with a certain value which is symbolized in the form of a color according to the value. To help read the map, a legend was created to determine the color class used and a getfeatureinfo technique to display attributes by clicking on the area.
The web map was developed using file-based webGIS techniques involving HTML, CSS and OpenLayers software and geospatial data packaged as a file in GeoJSON format. This technique was chosen because it does not require a map server application, just using a web server. By using this technique poverty and IDM applications can be hosted on Netlify's open site. The basic Netlify site accepts applications developed with HTML, CSS and Javascript software.
MAPS OF POVERTY AND IDM STATUS OF THE WEST JAVA PROVINCE 2017-2023
STATUS OF REGENCY/CITY POVERTY
STATUS OF REGENCY/CITY IDM p>
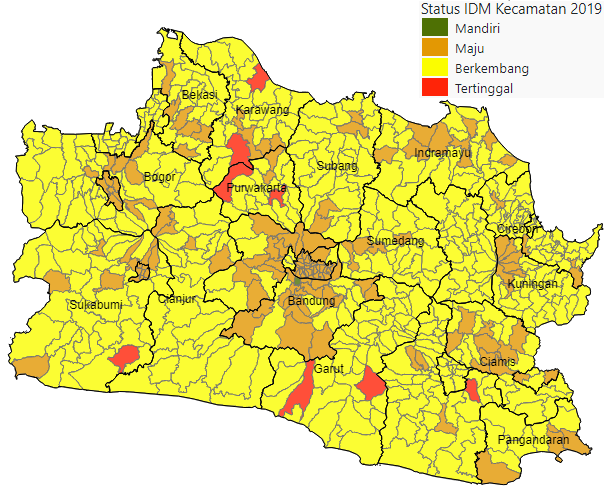
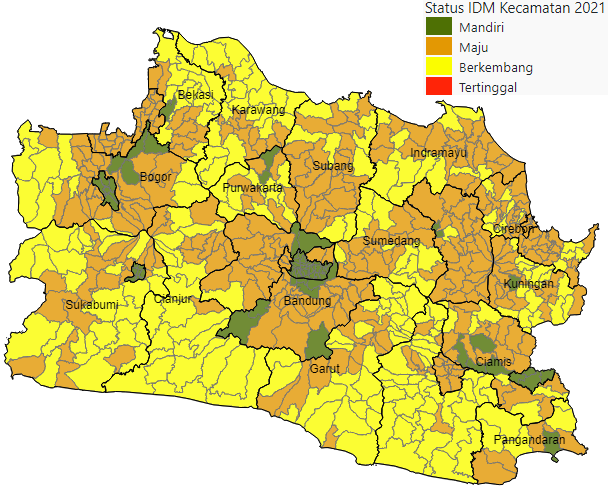
STATUS OF SUB-REGENCY IDM

REFERENCES
- Arifin, J. (2020). Budaya Kemiskinan Dalam Penanggulangan Kemiskinan Di Indonesia. Sosio Informa : Kajian Permasalahan Sosial Dan Usaha Kesejahteraan Sosial, 6(2), 114-132. https://doi.org/10.33007/inf.v6i2.2372
- Azizah, N.N.N., Rohimah, S.R. and Sumargo, B. (2021) Pemodelan Data Kemiskinan di Provinsi Jawa Barat Menggunakan Regresi Spasial Data Panel, Jurnal Statistika dan Aplikasinya, 5(2), pp. 146-154.
- Badan Pusat Statistik (2023), Sebaran Penduduk Miskin di Provinsi Jawa Barat
- Badan Pusat Statistik (2022) Tinjauan Ekonomi Provinsi Jawa Barat 2021.
- Badan Informasi geospasial (BIG), akses website BIG.go.id, 2023
- Dwi Ardian, Muhammad Rizqi Destanto (2020). Pengaruh Faktor Sosial Ekonomi Terhadap Kemiskinan Di Provinsi Jawa Barat. Prosiding Seminar Nasional Official Statistics 2020: Statistics in the New Normal: A Challenge of Big Data and Official Statistics
- Elisabet Siahaan. Prof. (2022). Cara Hitung Kemiskinan Ideal. https://sumatra.bisnis.com/read/ 20220703/533/1550788/cara-hitung-kemiskinan-yang-ideal-begini-kata-akademisi
- Farah Salsabila Muchtar, Atih Rochaeti, Aan Julia (2017). Pengaruh Infrastruktur Ekonomi terhadap Pertumbuhan Ekonomi Regional Jawa Barat 2010-2015. Prosiding Ilmu Ekonomi Vol.3 No.1 Tahun 2017. ISSN : 2460-6553
- Hardinandar, F. (2019). Determinan Kemiskinan (Studi Kasus 29 Kota/Kabupaten Di Provinsi Papua). Jurnal REP (Riset Ekonomi Pembangunan), 4(1), 1-12. https://doi.org/10.31002/rep.v4i1.1337
- Winoto, Joyo dan Siregar, Hermanto. 2006. Peranan Pembangunan Infrastruktur Dalam Menggerakan Sektor Rill. Jurnal Ekonomi Indonesia. No 1.
- Sudarsana. 2009. Program Raskin Sebagai Penanggulangan Kemiskinan di Indonesia. Jurnal Sosiologi. Vol. 21 No 2.
- Katamso Noto Santoso), Fayadh Abiyyi, Andika Roy Khian Marselino (2022). Analisis Spasial Kemiskinan pada Masa Pemulihan Pandemi Covid-19 di Jawa Barat Tahun 2021. Jurnal Statistika dan Aplikasinya, Vol. 6 No.2, December 2022.
- Kemenkeu (2023). Artikel Kemiskinan. https://djpb.kemenkeu.go.id/kppn/lubuksikaping/id/data-publikasi/artikel/3155-kemiskinan-makro-dan-kemiskinan-mikro.html
- Laga Priseptian1, Wiwin Priana Primandhana (2022). Analisis faktor-faktor yang mempengaruhi kemiskinan. Copyright © 2022, FORUM EKONOMI ISSN Print: 1411-1713 ISSN Online: 2528-150X.
- Nur Halimatussa diyah, Ginanjar Wiro Sasmito, Dyah Apriliani (2021). Aplikasi Klasifikasi Status Kemiskinan Warga Di Kabupaten Tegal. Jurnal Sistem Komputer Volume 10, Nomor 1, April 2021.
- Peraturan Menteri Desa, Pembangunan Daerah Tertinggal dan Transmigrasi No. 2 Tahun 2016 tentang Indeks Desa Membangun. Rencana Pembangunan Jangka Panjang Nasional (RPJPN 2005-2025).
- Riadi B, Munajati SL, 2008, Kajian Infrastruktur Jalan di Jawa Barat Bagian Selatan. Globe Vol.10 No.1 Juni 2008 Hal.68-75
- Teguh Ammar Taqiyyuddin dan Muhamad Irfan (2022). Faktor Penyebab Kemiskinan di Provinsi Jawa Barat Menggunakan Spatial Autoregressive Quantile Regression. Jurnal Sains Matematika dan Statistika .Vol. 8, No. 1, Januari 2022 Hal. 59-69
- Topcu, E. (2022) The impact of COVID-19 on regional poverty: Evidence from Latin America, in COVID-19 and the Sustainable Development Goals. Elsevier, pp. 399-412.
- Undang - Undang Nomor 6 Tahun 2014 tentang Desa Website resmi IDM Kemendesa PDTT - https://idm.kemendesa.go.id
- World Bank (2020) Poverty and Shared Prosperity 2020: Reversals of Fortune, [Preprint]. Available at: https://doi.org/10.1596/978-1-4648-1602-4.